In the course I am teaching at Berkeley this semester, I have 8 graduate student assistants. They teach students once a week in discussion sections and they also grade the exams. During the exam grading I provide the graders with pizza and soda. Here is a photo of a few of the graduate students during the grading of one of the midterms:
The pizza was purchased at the canonical pizza place north of campus.
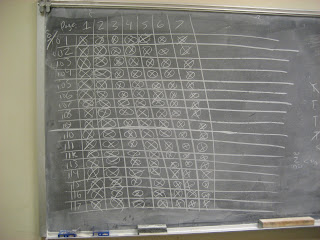
During the grading, exams were kept in separate piles for the 17 discussion sections (each section was in a different yellow folder, as seen in the photo). To keep track of when the exams in a section were being graded, and which page of the exam was being graded for that section, we used a chart on the blackboard, where columns were page numbers from the exam and rows were discussion sections (101 to 117):
I'll explain where all the X's and O's in the chart came from. When someone started to grade a particular page on the exam from a particular section (each grader was in charge of grading a different page), the appropriate row and column would get an O placed in it. Once the grading was done for that page in that section, an X was placed in the O. The above photo shows the chart once the grading was over: every row and column entry has an O with an X inside it. After I saw the filled-in chart I said to the graduate students "I have never seen so many tensor product signs together in my life. But it's nothing to be afraid of, since the board is flat." (The end of that comment is a pretty funny higher-level math joke, but if it fell flat for you then the humor can't be explained.)


No comments:
Post a Comment